Every compliance officer knows the feeling. You are sitting across the table from your supervisor, defending the methodology behind your Business-Wide Risk Assessment. The numbers add up, the logic is documented – and yet the questions keep coming. Why measure residual risk this way and not another? Why these thresholds and not others?
Until now, that conversation always happened on uneven terms. Supervisory scoring models were rarely disclosed, and institutions were left to guess what benchmark their assessors were actually using.
That has changed. The EU’s new AML/CFT Single Rulebook – anchored by AMLR, AMLAR, AMLD6, and the revised Transfer of Funds Regulation – places AMLA at the centre of EU-level AML supervision. And for the first time, the Regulatory Technical Standard under Article 12(7) AMLAR makes AMLA’s risk scoring methodology publicly available in enough detail to understand its structure, its logic, and its implications for every obliged entity in scope.
This article unpacks that methodology: the three-step inherent–controls–residual framework AMLA will use to select its 40 directly supervised entities, why it matters beyond that group, and how financial institutions can adapt its architecture for their own Business-Wide Risk Assessment – before July 2027, when the same data points land on national supervisors’ desks too.
1. Why AMLA Needs Market-Wide-Risk-Assessment?
AMLA’s supervisory remit is deliberately narrow as the resources of the authority are not limitless. The AMLA is mandated to directly supervise relatively a small set (40 to be precise) of selected obliged entities – credit and financial institutions whose cross-border footprint and residual risk profile make them systemically relevant for EU-level oversight. Every other obliged entity remains under the supervision of its national AML/CFT authority, with AMLA exercising indirect oversight through coordination, standard-setting, and convergence of practice. Understanding where the line falls – who is eligible for direct supervision, and on what basis – is therefore the starting point for AMLA to operationalize its supervisory mandate.
The selection itself is driven by two factors: the cross-border footprint of an institution’s activities and its ML/TF risk exposure. In other words, this is risk-based supervision – the supervisor’s own version of the risk-based approach you already use to prioritise AML/CFT effort. The logic should feel familiar – this is what business-wide risk assessments and individual client risk scoring is used for.
Only entities that pass both stages of selection become eligible for direct supervision of AMLA – each stage is a hard prerequisite.
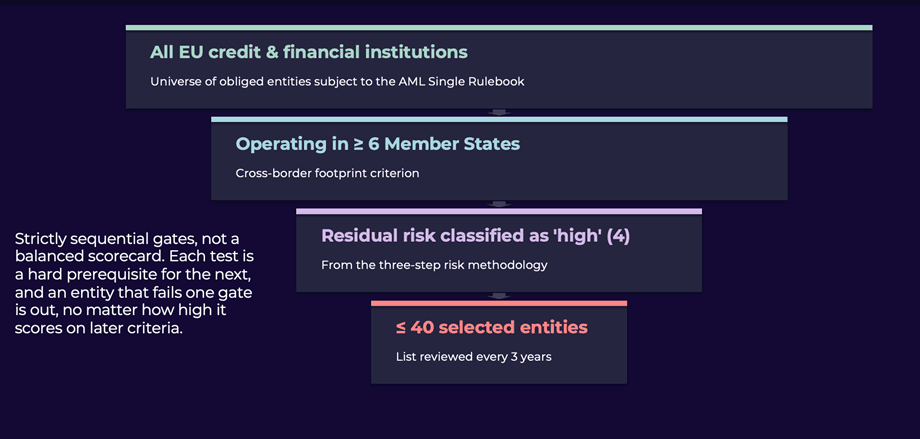
Figure 1. Up to 40 directly supervised entities selection funnel
Stage 1 – Geographic Eligibility
In the first stage, AMLA identifies all credit institutions, financial institutions, or groups thereof that operate in at least six Member States, including the home Member State. Presence can be established either through a physical establishment (branch or subsidiary) or by conducting operations under the freedom to provide services (FPS).
For FPS operations to count toward the six-Member State threshold, they must meet the materiality thresholds defined in the Regulatory technical standard. Specifically, a Member State is counted as an active jurisdiction if either of two alternative conditions is met: the institution has more than 20,000 customers resident in that Member State as of 31 December of the preceding year, or the total annual value of incoming and outgoing transactions generated by those customers in the preceding year exceeds EUR 50 million. These thresholds are alternative, not cumulative: meeting either condition suffices.
Where multiple entities within the same group conduct FPS activities in the same Member State, their activities are aggregated for the purpose of the threshold calculation. This is significant for groups that distribute business across subsidiaries: the combined footprint may trigger eligibility even when no individual entity meets the threshold alone.
Stage 2 – Risk Profile Assessment
Having identified all eligible entities in Stage 1, AMLA applies the three-step risk scoring methodology described in the RTS to each entity. Only those whose residual risk profile is classified as High (score ≥ 3.25) proceed to direct supervision. The cap on the number of directly supervised entities is 40.
And this is where it gets interesting. What methodology has the central hub of all supervisors chosen for its own risk assessment? What data will feed into it? Personally, I find these questions far more compelling than the outcome – the list of selected entities itself. Frankly, most of us could already guess the first ten names on that list. Don’t you agree?

Figure 2. The two gating tests under the AMLAR selection process
2. The Blueprints of AMLA’s Risk Scoring Methodology – Step by Step
AMLA’s risk scoring methodology follows three sequential steps. Each step builds on the result of the previous one, producing a final residual risk score that drives the selection decision. Score 3.25 or above and you’ve crossed into High ML/TF risk territory – congratulations, you now have AMLA’s direct attention.
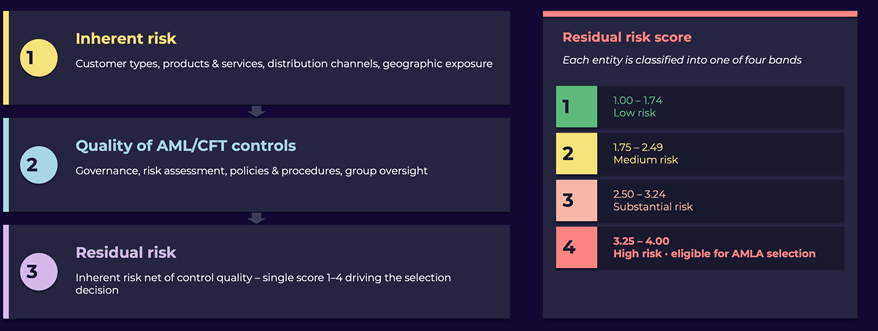
Figure 3. The three-step risk scoring methodology at a glance
The three-step structure above resolves a question that has long divided risk practitioners: should ML/TF risk be measured along a probability-versus-impact axis – the classical heat-map approach inherited from operational risk, safety engineering and project risk management – or along an inherent-risk-versus-controls axis?
AMLA has now made its preference unambiguous by adopting the Inherent–Controls–Residual model. In doing so, it aligns AML risk assessment with the broader enterprise-risk tradition set out in COSO ERM and ISO 31000, which separate inherent exposure from the effect of controls rather than collapsing both into a single probability-weighted loss figure. That same logic has long been carried into financial-crime practice by the Wolfsberg Group, which has consistently framed residual risk as a function of inherent exposure and the quality of the AML/CFT programme – and explicitly rejected probability-of-loss models as ill-suited to predicate offences that are deliberately concealed.
The choice may be partly pragmatic. The Single Supervisory Mechanism (SSM) – the EU’s centralised prudential supervisor, assessing credit, market, liquidity and operational risk in significant banks – has long applied a structurally similar approach, separating inherent risk from governance and controls to arrive at a supervisory score. From 2027, SSM and AMLA will share more than a Frankfurt postcode: they will share the basic architecture of how an EU-level supervisor evaluates risk.
So let’s return to the opening picture: you are sitting across the table from your supervisor. Which benchmark do you suppose they will reach for when picking apart your risk-assessment methodology? The textbook answer is – none. A supervisor is meant to be neutral on methodology, so long as the methodology fits the purpose. Yet… It is up to you if to rely on textbook or on human judgement who is working with one specific risk scoring methodology.
Step 1 – Inherent Risk Score
The inherent risk score captures an institution’s ML/TF exposure before any mitigating controls are taken into account. It is derived from four categories of indicators: customer, channel, geographies, products &services.
The customers category covers the composition of the customer base, including the proportion of politically exposed persons (PEPs), customers linked to high-risk third countries, legal entities, and customers engaged in higher-risk economic activities. The products and services category addresses the institution’s service portfolio – from correspondent banking and private banking through to crypto-asset services – with sub-categories for specific product lines, each scored separately. The distribution channels category reflects the means by which customers are acquired: remote onboarding, intermediary introductions, and third-party distribution carry higher inherent risk than direct branch contact. The geographies category captures the proportion of transactions and customer relationships involving high-risk or offshore jurisdictions.
The calculation itself proceeds in five layers, built from two ingredients per indicator: a score and a weight. The score captures the risk level of that indicator and is derived from its underlying data points; the weight captures how much that indicator counts in the aggregate (the significance of the indicator). The thresholds that turn a data point into a a score (1, 2, 3 or 4) or a weight (1, 2, 3, 4 or 5) are, naturally, not disclosed – they remain under AMLA’s discretion. Now… if we had those ingredients in hand – or at least a clearer recipe for how they are “cooked” together – we would have AMLA’s full methodology. My best guess? The weights track the share of higher-risk exposures in an entity’s portfolio, and the scores are anchored to the supranational risk assessment, seasoned with a healthy dose of supervisory expert judgement. I might be right or I might be wrong – this is only a guess…
The full list of indicators, however, is in the open: the same indicators serve as the data points financial institutions will be required to report under parallel risk-based supervision RTS (RTS on the assessment of the inherent and residual risk profile of obliged entities under Article 40(2) of Directive (EU) 2024/1640) as well as for AMLA for AMLA’s selection purposes. The dataset is comprehensive (example in Figure 4), and every institution within scope will have to build the extraction pipelines for it anyway. In practical terms, it is the same dataset an institution can – and arguably should – use internally for its own business-wide risk assessment.
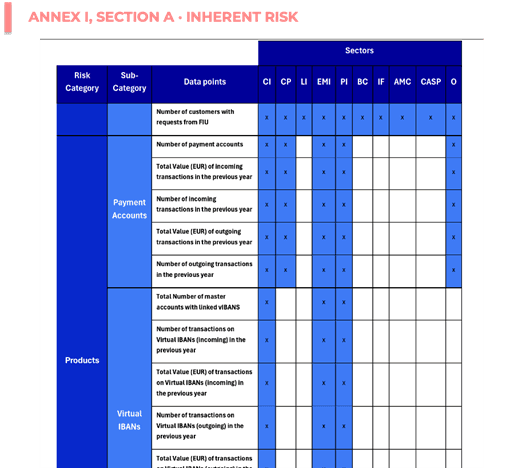
Figure 4. Inherent Risk indicators by sector (AMLA RTS under Article 12(7)(b) AMLAR).
The calculation of inherent risk then unfolds into these steps:
First – score each indicator on a 1–4 scale (1 = lowest risk, 4 = highest);
Second – within each Products & Services sub-category (payment accounts, vIBANs, pre-paid cards, lending, factoring and so on), combine the indicator scores into a sub-category score through a weighted arithmetic average, with each indicator carrying a weight from 1 to 5 (1 = lowest risk significance, 5 = highest).
Third – compute a score for each of the risk categories as a weighted arithmetic average of its inputs. The same 1–5 weighting scale applies.
Fourth – combine category scores into a single inherent risk score, again as a weighted arithmetic average and again on the 1.00–4.00 scale (two decimal places).
Fifth – map the resulting score to one of four risk bands: Low (1.00–1.75), Medium (1.76–2.50), Substantial (2.51–3.25), High (3.26–4.00).
A small caveat is in order on what one might have expected to be a sixth step. The parallel RTS addressed to national supervisors (RTS on Article 40(2) of AMLD6 on the entity-level risk assessment methodology) mostly mirrors the AMLA RTS under Article 12(7)(b) AMLAR, but adds one further step that AMLA’s own methodology deliberately does not include:
Step 6 – Inherent risk override (national supervisors only). Under the national-supervisor RTS, competent authorities may, in exceptional cases, adjust an entity’s inherent risk score upward or downward to reflect national specificities or other supervisory considerations not adequately captured by the harmonized indicators.
AMLA chose to leave this lever out of its own methodology, in plain terms indicating that: national supervisors keep a calibrated escape hatch for local circumstances; AMLA, which operates across all participating Member States and selects directly supervised entities on a comparable basis, does not. The omission is a design choice, not an oversight – a level playing field is incompatible with twenty-seven slightly different definitions of “high risk.”
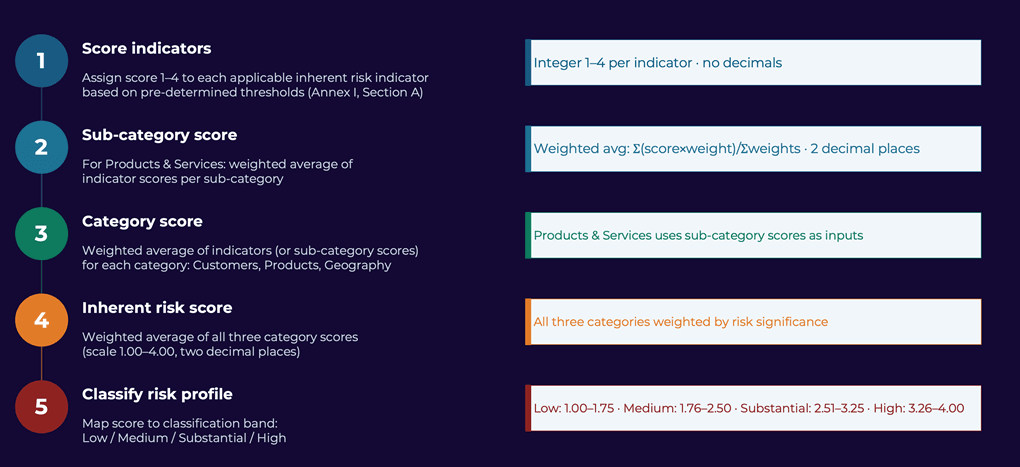
Figure 5. The five-step inherent risk calculation under RTS.
EXAMPLE – Inherent Risk Score for a Mid-Sized Payment Institution (illustrative only)
Those are the regulatory ingredients fresh out of AMLA’s oven. To see how they actually taste, let’s plate them up with an imaginative example. One caveat: whether our seasoning matches AMLA’s own recipe – in other words, whether our reading of the indicators and weights is the one AMLA had in mind – only AMLA itself can ultimately confirm. Example is simplified (no actual data points analyzed) and not necessarily accurate. However you will definitely have a taste of supervisory methodology.
Let’s assume payment institution has come through the “funnel” of cross-border selection criteria and is now in scope for AMLA’s risk scoring.
❶ Scores and weights attached for each indicator
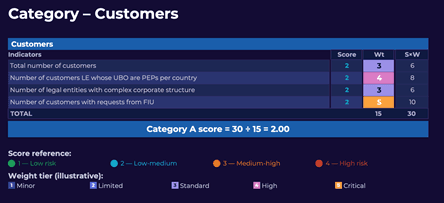
❷ Scores and weights attached for each indicator within Products&Services sub-category
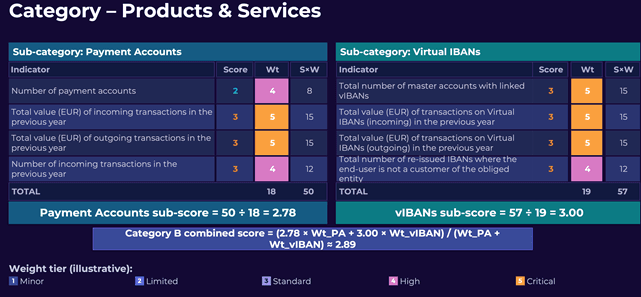
❸ Compute a score for each of the risk categories, combine category scores into a single inherent risk score, again as a weighted arithmetic average. Map the resulting score to one of four risk band.
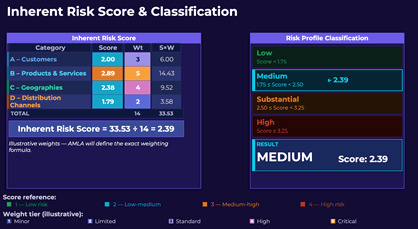
This may not be a perfect resemblance of AMLA’s methodology – but hey, it is the first batch out of the RTS oven. Let’s see how AMLA refines the recipe from here, and in the meantime, there is nothing stopping you from sketching a design for your own risk assessment methodology. Perhaps a touch fancier than your taste (you don’t need all ingredients, and you have a simpler kitchen) – but well, it is AMLA after all.
Step 2 – Controls Quality Score
The controls quality score assesses the effectiveness of the institution’s AML/CFT programme in addressing its inherent risk exposure. RTS draws on six categories of control indicators all listed in Annex I of the same RTS.
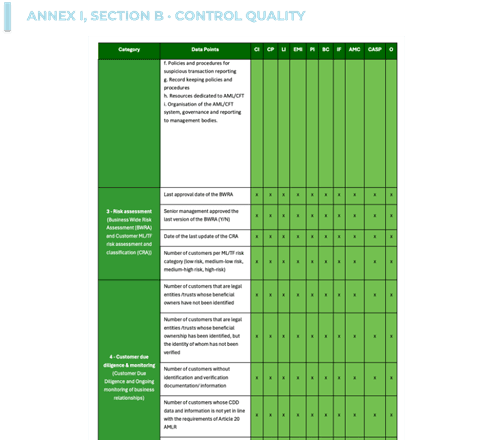
Figure 6. Control indicators by sector (AMLA RTS under Article 12(7)(b) AMLAR).
The six categories are: governance and culture, covering board oversight, the seniority and independence of the AML/CFT compliance officer, and the three-lines-of-defence model; internal controls and outsourcing, covering the adequacy of procedures and the governance of third-party and outsourced AML functions; risk assessment, addressing the quality and coverage of the institution’s own business-wide and customer risk assessments; customer due diligence, covering identity verification, UBO identification, and the completeness of customer files; transaction monitoring and suspicious activity reporting, covering the effectiveness of monitoring systems and the volume and quality of STR/SAR reporting; and targeted financial sanctions, covering the institution’s sanctions screening capabilities and the management of designations.
Each indicator within these categories is scored on the same 1–4 scale, where 1 represents the highest quality of controls and 4 the lowest. Category scores are calculated via a weighted arithmetic average: weights corresponding the significance of indicator. This mirrors the inherent risk scoring logic and ensures that the most deficient area of a compliance program dominates the overall assessment.
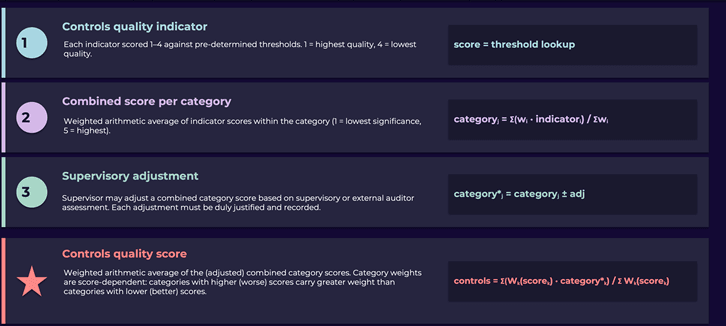
Figure 7. Translating each control’s A–D rating into a quality score (AMLA RTS, Article 12(7)(b) AMLAR).
RTS permits supervisors to adjust a combined category score based on supervisory assessments – including full-scope or targeted on-site inspections and thematic off-site reviews – or on findings from external auditors. Each adjustment must be duly justified and recorded.
The controls quality score is then classified on a four-level quality scale: A (Very good, score below 1.75), B (Good, 1.75–2.50), C (Moderate, 2.50–3.25), or D (Poor, 3.25 or above).
EXAMPLE – Control Quality Score (illustrative only)
A simplified illustration follows – close in spirit, not in detail (and yes, the devil’s still in the details; the spirit may not look entirely heavenly).
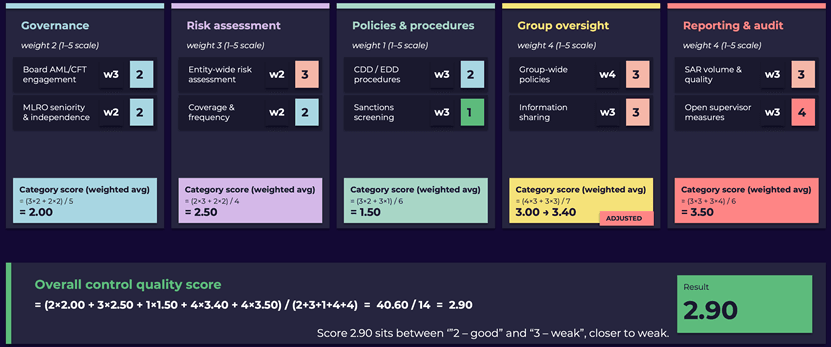
❶ Score each control indicator (1–4) and assign it a weight (w = 1–5).
❷ Combine the indicators into a category score by weighted average.
❸ Adjust the category score – e.g. in this case “Group oversight” category score uplifted from 3.00 to 3.40 following a supervisory inspection.
❹ Take a weighted average of the five category scores, where each category’s weight equals its own score – so weaker controls (higher score) carry greater weight.
Step 3 – Residual Risk Score
The residual risk score is derived from the inherent and controls quality scores through a conditional rule defined in the RTS. The rule has two cases which one to move forward with depends if controls quality score is larger, equal or lower than inherent risk score:

Figure 8. How residual risk is calculated (AMLA RTS under Article 12(7)(b) AMLAR).
Remember the examples above? The summarized version of a simplified example might look like this:

3. Adapting AMLA’s Methodology for Financial Institutions’ Risk Assessment Framework
AMLA built this methodology for supervisors looking across institutions, not for compliance teams looking across customers. That orientation matters when deciding where to reuse it. Done thoughtfully, the framework is a serious upgrade to a medium-to-large institution’s business-wide risk assessment (BWRA/EWRA).
Pushed down to individual customer risk scoring, it collapses under its own weight: the inherent risk side alone draws on roughly 100 data points across four categories, several of which – the institution’s geographic footprint, its correspondent banking exposure, its distribution-channel mix – are entity-level facts that simply do not map onto a single customer. A customer-level adaptation would need to strip away most of what makes the AMLA model useful. Compliance teams already have purpose-built customer risk-rating tools, calibrated to the indicators that genuinely vary at the customer level (PEP status, geography, product mix, transactional patterns, beneficial-ownership opacity). Better to leave AMLA’s framework where it adds value and let CDD-level scoring do what it was designed to do.
At entity level, the fit is close to one-to-one. The four inherent risk categories – customers, products and services, distribution channels, and geographies – are the dimensions of any BWRA. The six control categories – governance and culture, internal controls and outsourcing, risk assessment, CDD quality, transaction monitoring and SAR, and targeted financial sanctions – cover what a credible BWRA controls assessment already needs to address. The ~100 inherent data points and the indicator-level controls catalogue give you a ready-made template; institutions that collect and maintain data against them are already building the quantitative inputs supervisors will increasingly expect.
It would be naïve to pretend the model is light. The combination of weighted averages within sub-categories, weighted averages across categories, controls scale, and a conditional residual rule is heavier than most institutions’ current BWRAs – and heavier than strictly necessary to arrive at a defensible risk picture. But complexity here is not waste. Each layer exists to stop a known failure mode: indicator-level weights stop a single bad data point from dominating, sub-category weights stop high-volume categories from drowning out high-risk ones, and the asymmetric residual rule (Residual = Inherent when controls are strong; average otherwise) stops institutions from explaining away inherent exposure with self-assessed controls. Used as a structural template rather than copied wholesale, it is a strong piece of methodology – and an honest upgrade on the BWRAs many institutions are running today.
And here is the kicker – from 10 July 2027, you WILL have to report those data points to the supervisor anyway. So why not put them to work for yourself first? Run the numbers, guesstimate how you’d look inside the supervisory model, and you have a rough early-warning tool: a sense of when, to expect a supervisor knocking on your door.
Treat the AMLA model as a skeleton you populate with your own institution’s data, not as a checklist to copy literally. Five practical moves:
- Adopt AMLA’s category architecture verbatim. Four inherent categories, six controls categories. This is what your supervisor will look for; it costs nothing to align.
- Substitute data points you have. By 10 July 2027 you will have to report the full set, but you do not need it all wired in tomorrow – start with the indicators your systems already produce, map them to the categories, and let the gaps show themselves so you know where to invest between now and then.
- Calibrate scoring thresholds to your portfolio. AMLA’s 1–4 inherent scale and A–D controls scale is sound, but the cut-offs in the RTS are calibrated for cross-institutional comparison. Recalibrate yours so an internal “High” actually reflects your tail risk.
- Apply the conditional residual rule as written. The asymmetric formula (Residual = Inherent when Controls > Inherent; average otherwise) is one of most valuable pieces of the model to import directly – it imposes the discipline of not crediting strong controls beyond the inherent baseline.
- Build in the adjustment hatches – and use them sparingly. AMLA lets supervisors uplift a controls category score after an inspection or audit finding and lets national supervisors override the inherent score upward or downward in exceptional cases. Mirror both in your own framework but document every adjustment and the reason for it.
Conclusion
AMLA’s risk scoring methodology, as defined in the final RTS under Article 12(7) AMLAR, is more than a supervisory selection tool. It is the foundation of a harmonised EU AML/CFT risk assessment standard that will shape supervisory expectations across all Member States – not only the forty institutions AMLA picks for direct supervision. By 10 July 2027 the same data points will land on national supervisors’ desks too, which means the methodology will quietly become the lens every obliged entity is judged through.
The fit is asymmetric, and that is worth saying plainly. At entity level the three-step logic – inherent risk, controls quality, residual risk – is close to a one-to-one upgrade for a medium-to-large institution’s BWRA. Pushed down to individual customer risk scoring it collapses under its own weight; the entity-level indicators were never designed to describe a single customer, and the purpose-built CRA tools you already run are the right answer there. The lesson is to put AMLA’s framework where it earns its keep.
The institutions that will be best positioned when the standard takes hold are those that start now: adopt AMLA’s four-by-six category architecture, substitute the data points you actually have, calibrate the thresholds to your own portfolio, apply the asymmetric residual rule as written, and build in the same adjustment hatches – with the same discipline of documentation. None of this is a compliance exercise for its own sake. It is the difference between defending your methodology on your own terms when the supervisor knocks, and discovering you were graded on theirs all along.
And if my best guesses about how AMLA will season its own recipe turn out to be slightly off, well – only AMLA can confirm. In the meantime, the RTS is open, the ingredients are on the counter, and there is nothing stopping you from preheating the oven.
Institutions should consult their legal and compliance advisers when determining the appropriate scope, timeline, and implementation approach for any changes to their risk assessment frameworks in light of the developments described in this paper.
AMLYZE’s configurable risk scoring engine is built around the same inherent–controls–residual logic AMLA will use to evaluate your institution. Book a demo to see how it works in practice.
References
- AMLA Final Report: Draft Regulatory Technical Standards on the risk assessment for the purpose of selection of credit institutions, financial institutions and groups of credit and financial institutions for direct supervision under Article 12(7) of Regulation (EU) 2024/1620 (AMLAR), December 2025.
- Draft Regulatory Technical Standards on the assessment of the inherent and residual risk profile of obliged entities under Article 40(2) of Directive (EU) 2024/1640 (AMLD6).
Legal Disclaimer
This white paper has been prepared by AMLYZE for informational purposes only and does not constitute legal advice. It does not reproduce AMLA’s actual risk scoring model – the live model is not, and will not be, in the public domain. What is presented here is AMLYZE’s reconstruction of the methodology from the publicly available RTS, together with illustrative examples designed to show how the framework might be applied.