AMLA’s risk-scoring methodology, published for the first time in the RTS under Article 12(7) AMLAR (December 2025), might be read as a blueprint an institution can adopt for its business-wide risk assessment (BWRA/EWRA) – and, on the whole, as a genuine upgrade.
It may well be – but applied bluntly it produces unfavourable results, because AMLA was not building a blueprint for an institutional EWRA; it was building a selection tool fitted to its own supervisory risk-based purpose. So I want to pick up from there, from a practitioner’s bench, and set out the pitfalls of importing such a “blueprint” without accounting for the EWRA’s purpose, the individual institution’s risk appetite, and a risk-based approach that keeps financial-crime prevention controls targeted at the risks the institution actually faces.
I have spent the past while building a product-level ML/TF/PF risk assessment methodology, and that work threw one property of AMLA’s residual layer into sharp relief: it might look like the job it was built for is the same as yours – targeting risk with additional controls – but it is different in kind. AMLA works to the supervisor’s risk appetite. Its model is a selection engine, built to target institutions with direct supervision, not to steer a firm’s own business lines towards financial-crime prevention. At bottom both instruments allocate finite resources against risk, but AMLA allocates supervisory resources across the financial system while your EWRA allocates them within a single institution. The purposes differ – and so the residual mechanic that is well-tuned for the first needs rework before it can serve the second.
This is a practitioner’s field guide, not a takedown. If you choose AMLA’s model as the backbone of your own EWRA without considering it’s initial purpose, a handful of pitfalls travel with it. None is fatal; each is manageable once you can see it coming. The architecture AMLA chose is sound, so I will say what it gets right, then walk through the three pitfalls that matter most and how to work around each. One caveat throughout: AMLA’s live scoring engine is not public and may differ from the RTS in implementation. I am engaging with the methodology as the RTS sets it out.
The residual risk rule, restated
AMLA scores an entity on two axes. Inherent risk runs 1 to 4, where 1 is the lowest risk and 4 the highest. Controls quality runs 1 to 4 as well but inverted: here 1 is the highest quality of controls and 4 the lowest. That inversion matters, because the residual rule compares the two scores directly and it is easy to read backwards. The rule (RTS Article 4) is conditional:
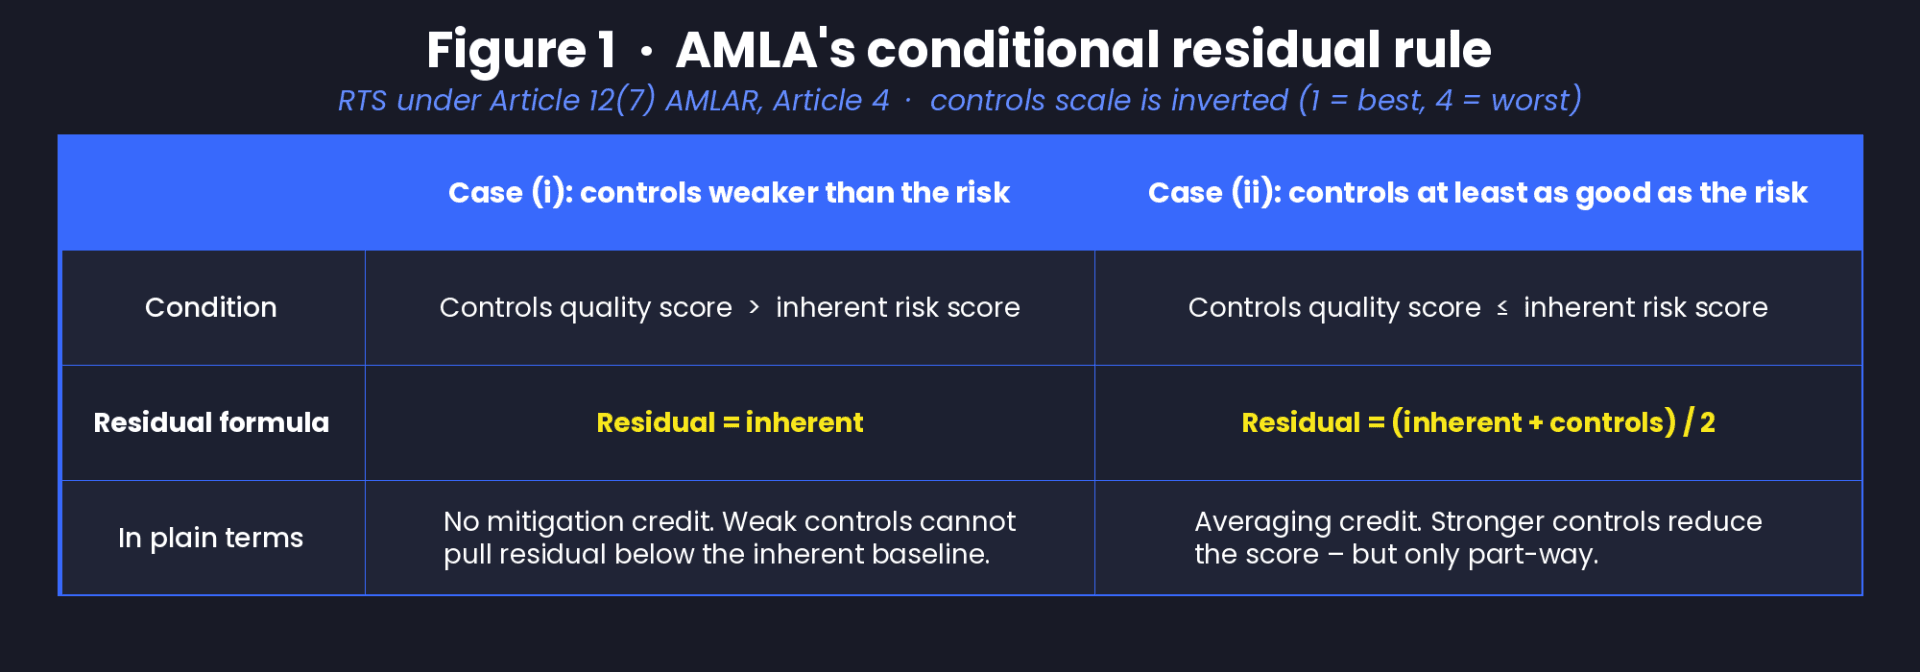
Figure 1. AMLA’s conditional residual rule (RTS under Article 12(7)(b) AMLAR, Article 4). Because the controls scale is inverted, a controls score numerically higher than inherent means controls are weaker than the risk they face: Case (i). It is worth restating the rule cleanly rather than relying on intuition, precisely because the two scales run in opposite directions.
Two things deserve credit immediately. First, the conditional structure is elegant. By holding residual at inherent whenever controls are weaker than the risk, it stops weak controls from ever pushing residual risk up so that controls can only reduce or hold, never amplify risk. This is rightly singled out as one of the most valuable pieces to import directly, and I agree without reservation. Whatever else you change when you adapt the model, keep the hard floor in Case (i).
Why the pitfalls exist: AMLA built a ranking engine, your EWRA is a different machine
To see why the residual layer needs rework, start with what AMLA built it to do. Under the AMLAR selection process, AMLA runs this methodology across every entity that clears the cross-border eligibility gate, then takes those whose residual profile is High (score ≥ 3.25) and caps the directly-supervised population at forty. The methodology is, in other words, a triage instrument. Its output is a position in a queue. To do that job it needs three things above all: one comparable number per entity; comparability that holds across twenty-seven Member States and every sector from correspondent banking to crypto; and robustness to gaming, and to the ragged, inconsistent data a thousand entities will report. For that purpose, compression is not a compromise.
Your EWRA answers a different question. It exists to tell you where your ML/TF/PF risk concentrates, where your next compliance euro should go, which products and business lines need attention, and what belongs in front of the Board. Its output is not a position in a queue it is a map for action. And a map for action needs the very things a ranking score is happy to discard: granularity, a response to control investment you can predict and plan against, and a calibration you can defend to your supervisor on your terms.
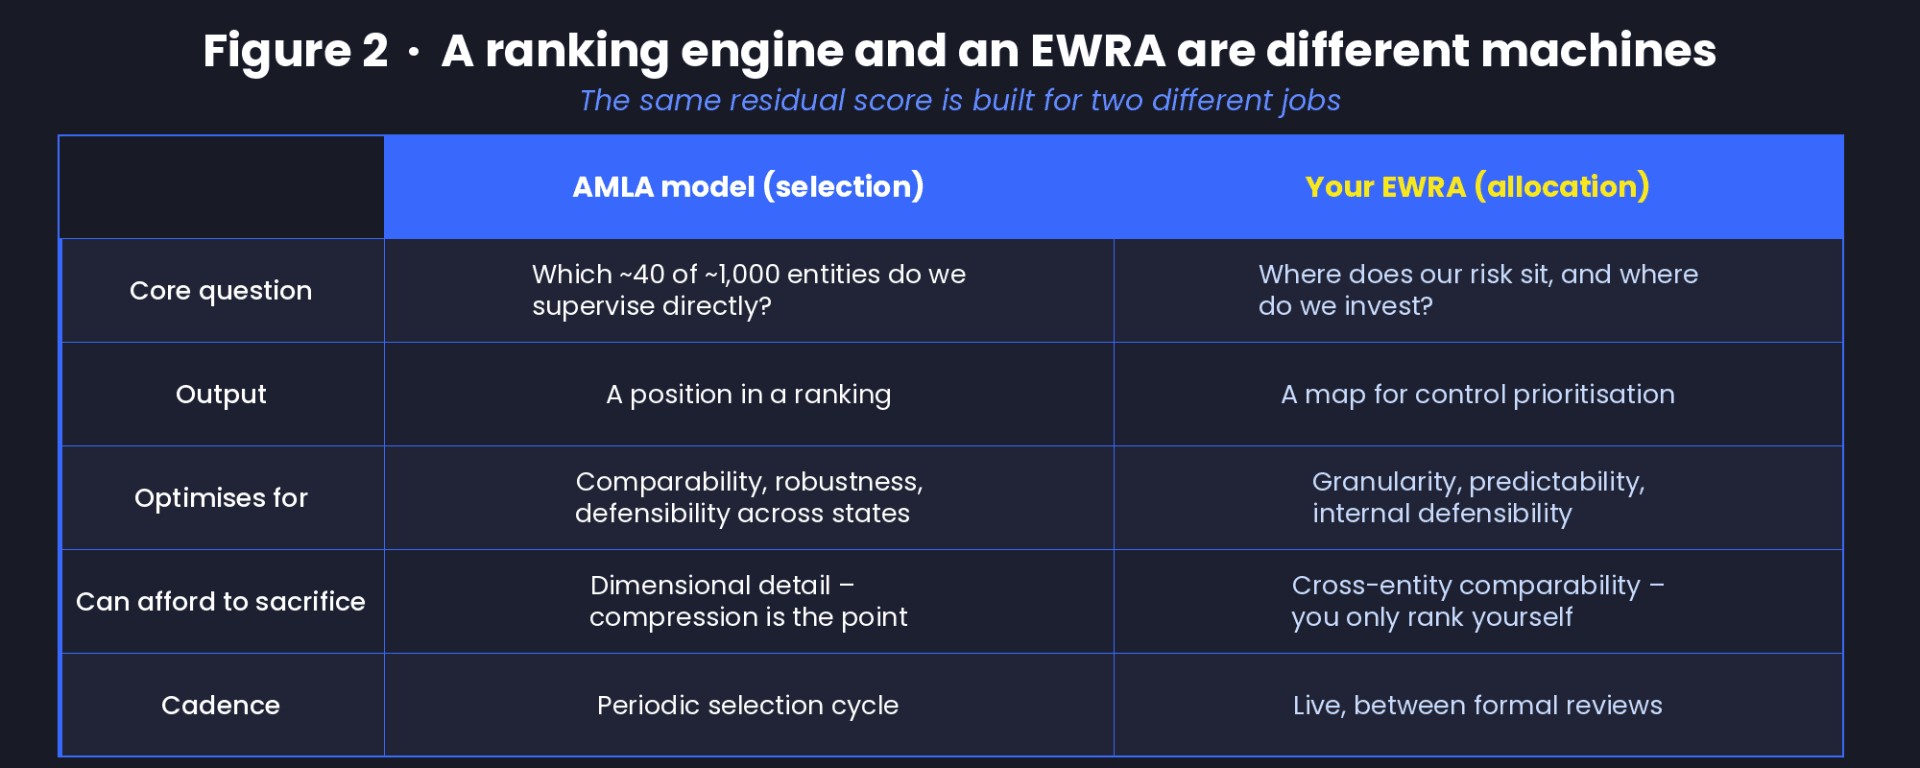
Figure 2. Why the same residual score serves two different jobs. A selection engine compresses by design; a resource-allocation engine must preserve structure.
One structural fact drives everything below, so it is worth stating plainly: AMLA produces a single controls quality score. The seven control categories: governance, culture and the compliance function; internal controls and outsourcing; the entity’s own risk assessment; customer due diligence and ongoing monitoring; transaction monitoring and suspicious activity reporting; targeted financial sanctions; and the group-wide AML/CFT framework (this last applying to groups) – are each scored, then collapsed into one number, which is compared against the one aggregated inherent score to produce one residual. The controls are never tied to the inherent categories they mitigate. For a ranking engine that is the right call; one number per entity is what the queue needs.
But “entity-level controls” and “a single controls score” are not the same thing, and conflating them is what trips up most internal adaptations. The same entity-assessed controls can instead be mapped to the risk dimensions they actually mitigate that is CDD to the customer dimension, transaction monitoring to the transactional dimension, sanctions screening to the geographic dimension with governance as a cross-cutting overlay. AMLA’s single controls score is simply the average of those mapped controls. So entity-level controls and per-dimension controls are the same control data at two different resolutions, and which resolution you keep decides whether your residual can tell you where to invest.
That yields three ways to build the residual layer, in increasing order of usefulness for an EWRA,. Figure 3 runs one product profile through all three.
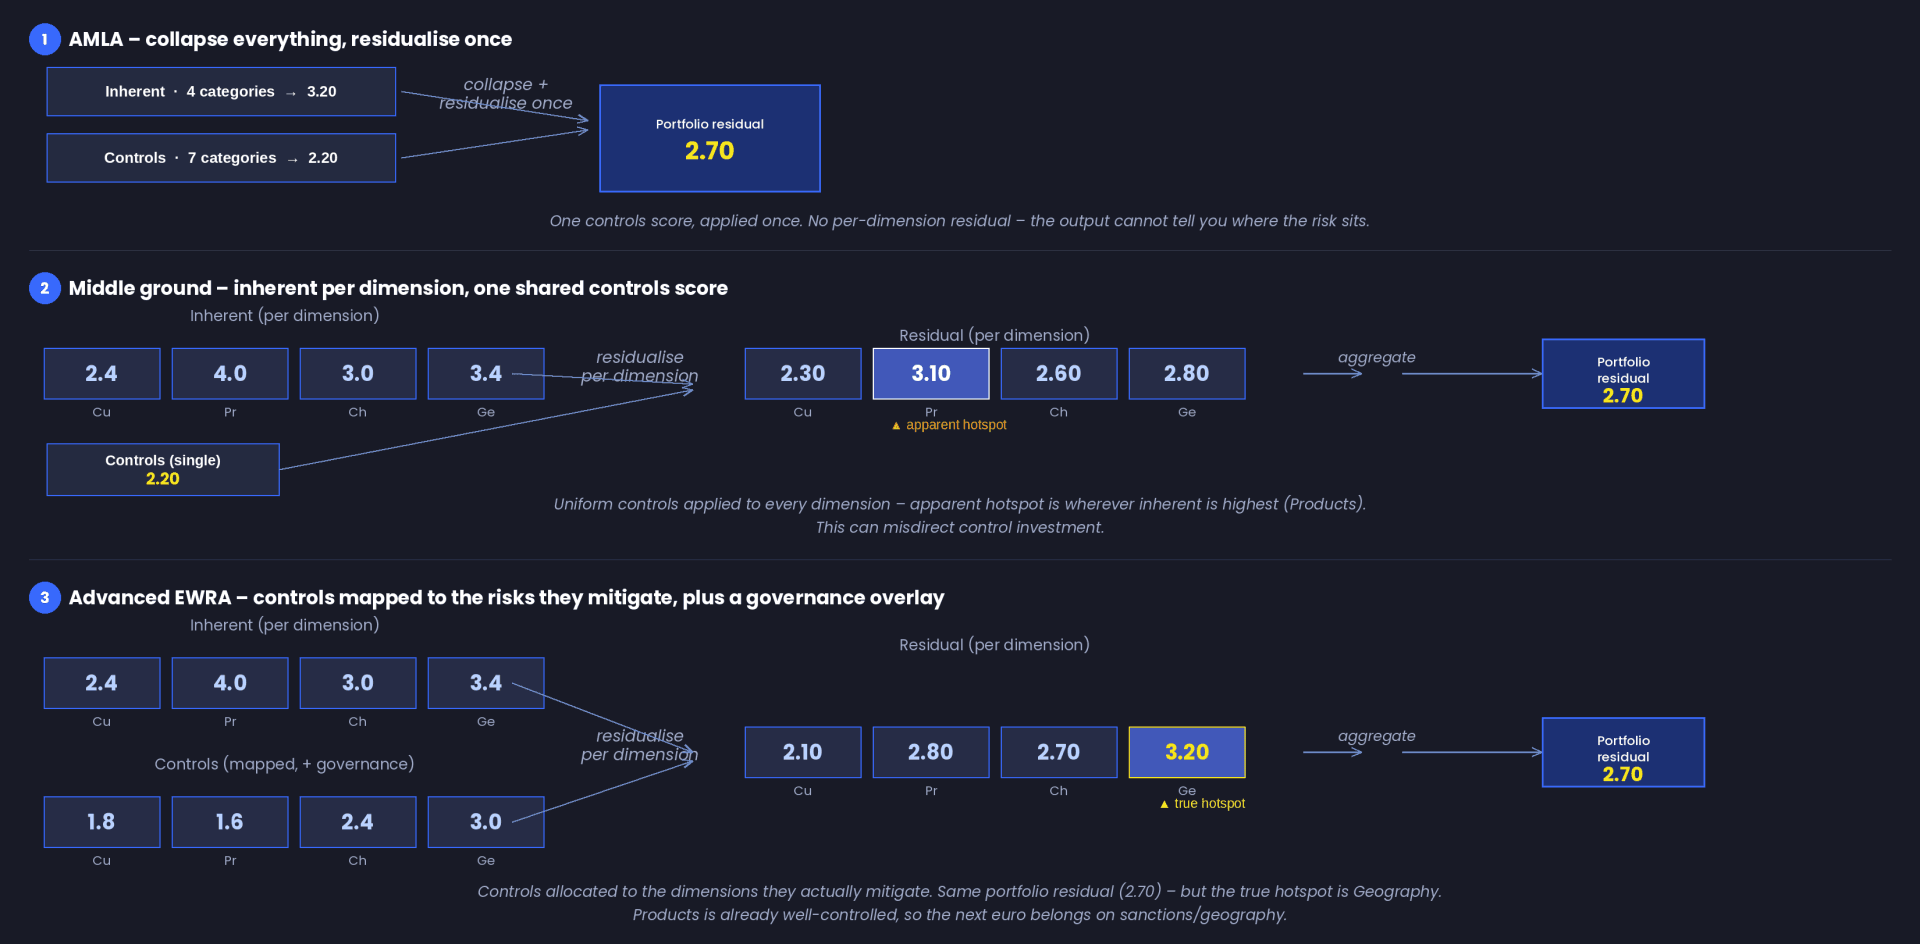
Figure 3. One product profile, three residual methods. Scenario 1 (AMLA) collapses inherent and controls to single scores and residualises once: one number, no dimensional view. Scenario 2 keeps inherent per dimension but applies the single entity controls score to each. Scenario 3 maps the entity controls to the dimensions they mitigate, plus a governance overlay. Scenarios 1 and 3 produce the same portfolio residual (2.70) but only Scenario 3 reveals the true hotspot. Every figure uses AMLA’s own conditional rule; the mapped controls average to the 2.20 single score, so it is the same control data shown at three resolutions.
Scenario 1 is AMLA, fit for ranking. Scenario 2 is the cheapest meaningful upgrade you stop collapsing the inherent and recover a per-dimension residual without changing how controls are assessed. Scenario 3 is where a methodology built upward from product-level risk assessment with an entity-level controls overlay sits: the controls are still assessed once, at entity level, but allocated to the dimensions and products they mitigate, with governance applied across all. The three sections that follow work through what changes as you move outward from Scenario 1 the mitigation ceiling, where the residual hotspot really sits, and the non-linearity that self-weighting introduces.
 Read related blog articles:
AMLA’s Risk Scoring Methodology: What Financial Institution Needs to Know
Monitoring Before the Relationship: What AMLA’s Draft RTS Means for Transaction Monitoring
Pitfall 1: the mitigation ceiling no one chose
Take Case (ii), the averaging branch the only branch where controls actually reduce the score. The best you can do is flawless controls: a controls score of 1.00. Residual then becomes (inherent + 1) / 2, and the reduction off inherent is (inherent − 1) / (2 × inherent). Work that across the scale:
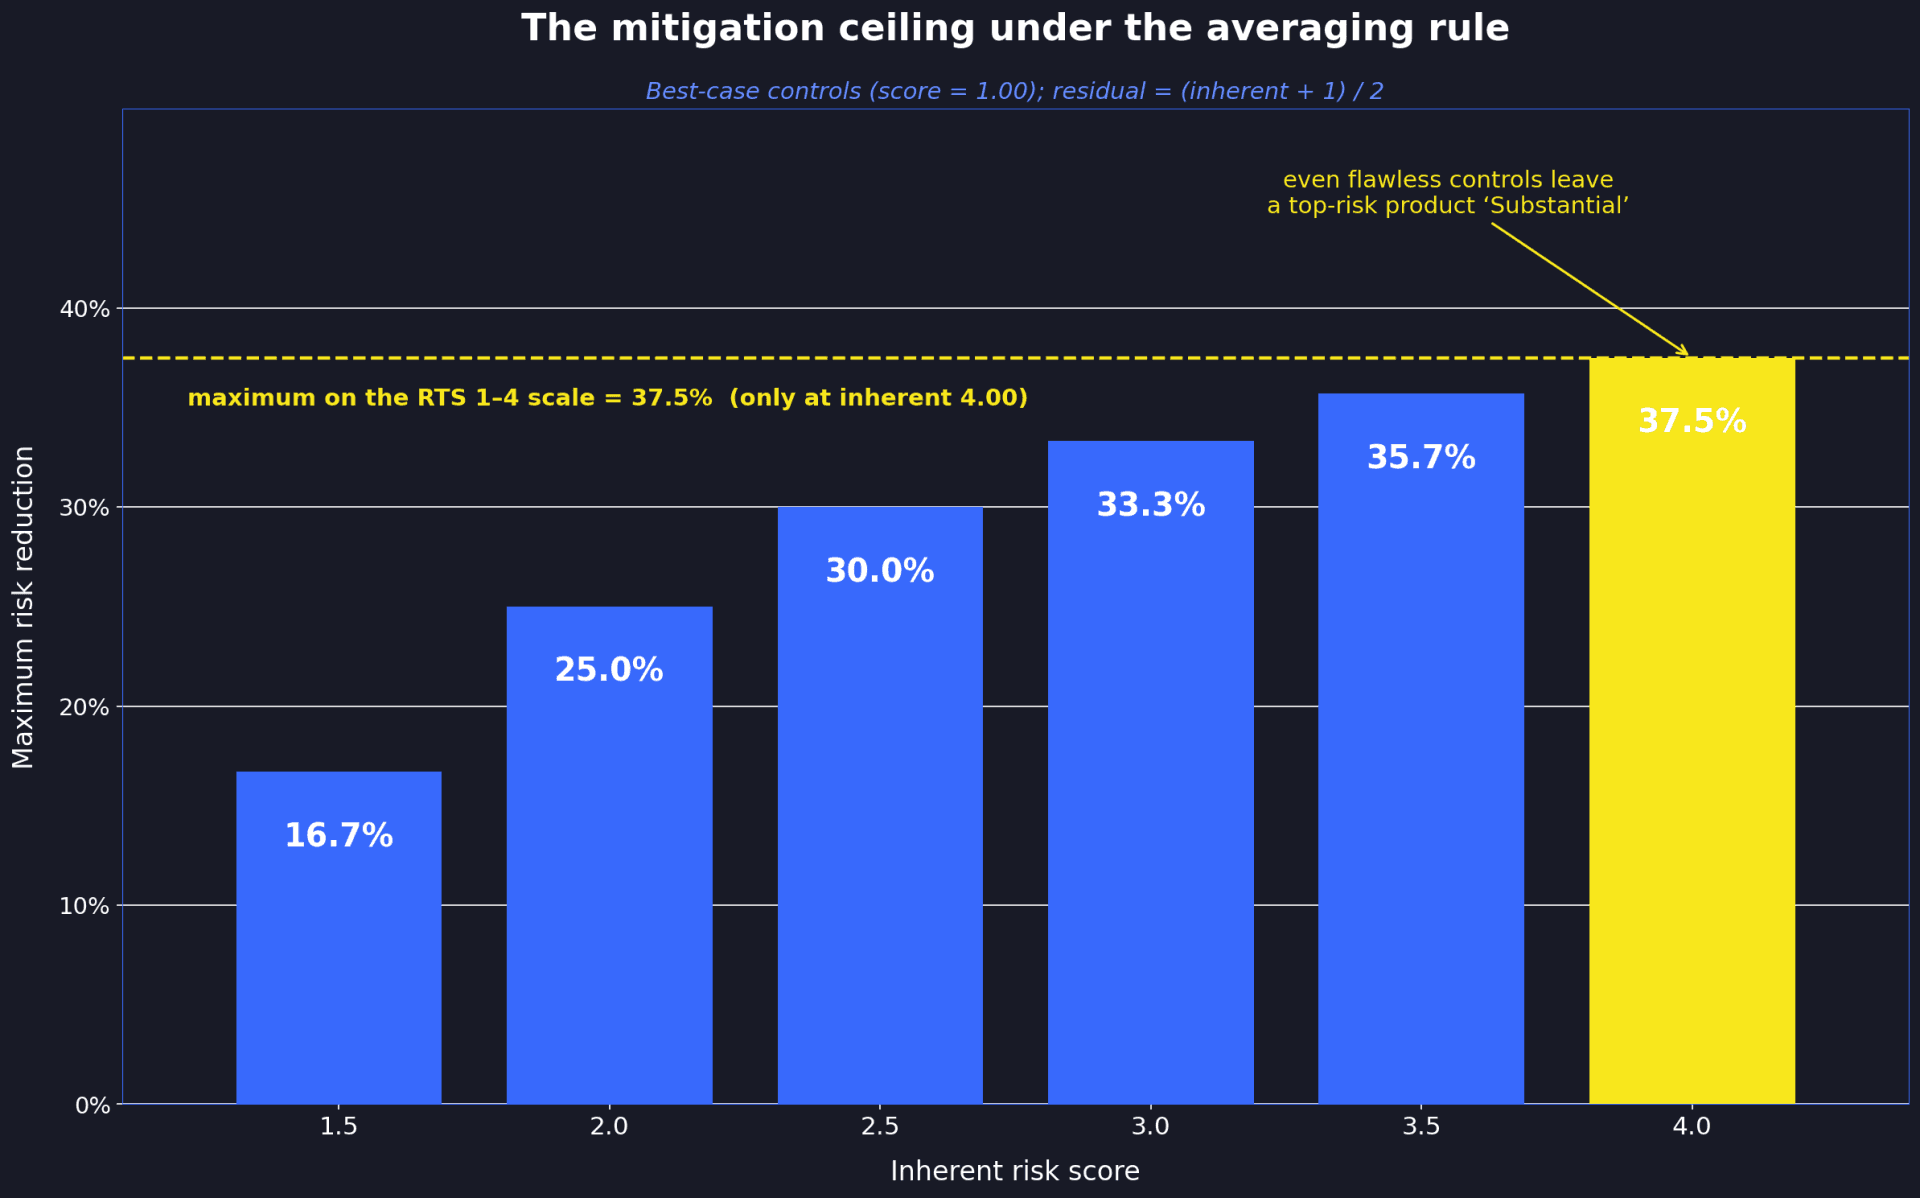
Figure 4. Maximum achievable risk reduction under the averaging rule, by inherent level (controls = 1.00, the best possible score). The ceiling is highest at the top of the scale and tightens as inherent falls.
A product at the very top of the inherent scale, defended by a perfect control environment, cannot move below 2.50. It stays “Substantial.” No amount of control quality will make a structurally high-risk product score low and lower down the scale the ceiling is tighter still: at an inherent of 2.50, your best-case reduction is 30%.
Here is the point, and it is not that 37.5% is the wrong number. It is that nobody chose 37.5%. It is stated nowhere in the RTS as a policy. It is an emergent property of having selected the arithmetic mean. For AMLA’s purpose this is harmless: ranking only needs relative position, and the ceiling applies to everyone equally. For your EWRA it is not harmless at all. The mitigation ceiling is the single most consequential number in your control narrative, it is the most your entire AML programme can reduce risk on your highest-risk products and if you import the averaging rule, you have adopted that number without anyone in your institution ever deciding it was right.
A well-built EWRA should be able to state its mitigation ceiling and defend the calibration. Why your controls reduce inherent risk by this much and not more? That is a genuine risk-appetite question, and it deserves a genuine answer. The averaging rule sidesteps it by never asking. This is where a different combination mechanic earns its place at entity level. A proportional (multiplicative) residual, one that applies a mitigation factor to inherent rather than averaging two scores and lets you set the ceiling deliberately and defend it, and it scales the reduction to the inherent level instead of fixing it by arithmetic accident. The contrast on a single high-inherent product:
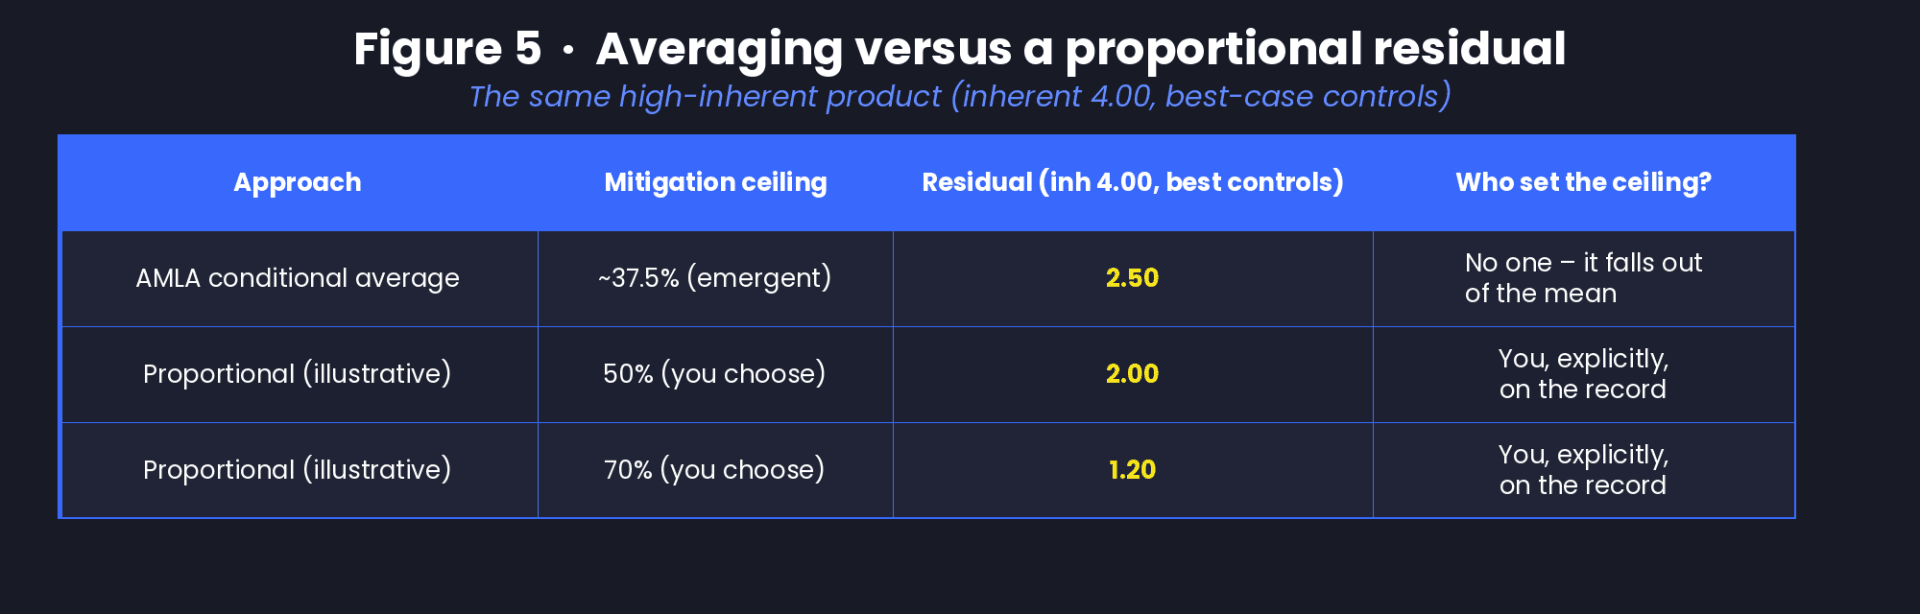
Figure 5. The same high-inherent product under averaging versus a proportional approach at two illustrative ceilings. The issue is not which residual is “correct.” It is whether the ceiling was a decision you can defend or a by-product you inherited. The illustrative ceilings are exactly that illustrative; the substance is that the choice should be explicit.
Pitfall 2: a single controls score hides where the risk really sits
Return to Figure 3 and read the residual rows. Scenario 1 hands you 2.70 and nothing else; you cannot act on it, because you cannot see which category produced it. That alone is the case for keeping inherent per dimension. But the sharper lesson is in the gap between Scenario 2 and Scenario 3. The difference between an EWRA that points you at the right control investment and one that points you at the wrong one.
In Scenario 2 the single entity controls score (2.20) is applied to every dimension, so the residual is highest wherever inherent risk is highest that is Products, at 3.10. A uniform control treatment cannot do anything else. You would conclude Products is your hotspot and send the next control euro there. In Scenario 3 the same controls are mapped to the dimensions they actually mitigate, and the picture inverts. Products turns out to be well-defended and strong product and transaction-monitoring controls pull its 4.00 inherent down to 2.80 while Geography, carrying weaker sanctions and geographic controls, barely moves and lands at 3.20. The true hotspot is Geography. Products was a decoy.
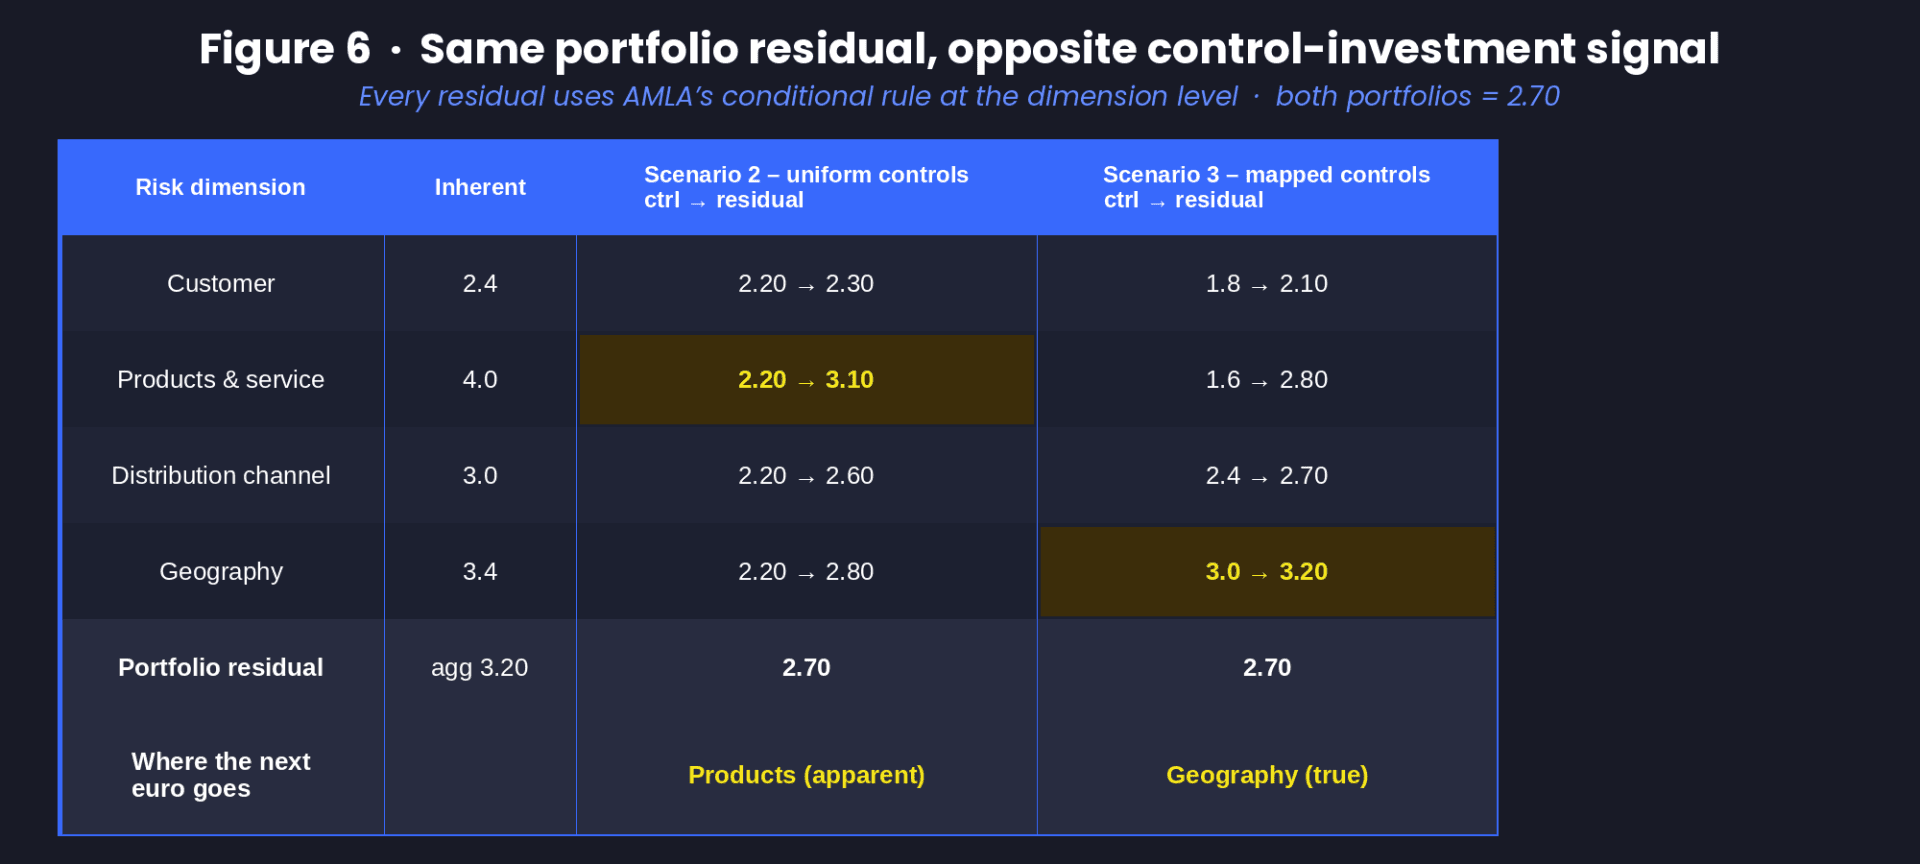
Figure 6. The verifiable arithmetic behind Figure 3’s middle and advanced scenarios. Every residual uses AMLA’s conditional rule at the dimension level. Under uniform controls (Scenario 2) the apparent hotspot is Products; under mapped controls (Scenario 3) it is Geography. Both portfolios sit at roughly 2.70 the headline number conceals which dimension needs the money. Simple averages used for aggregation; AMLA self-weights at the category step, which shifts the absolute figures slightly but not the conclusion.
For what AMLA was built to do – rank a large population of entities and select which to supervise directly – it does not need to know whether Products or Geography is the binding constraint, because either way the entity lands in the same place in the queue. That compression is the right call for a selection engine. An EWRA, though, exists precisely to answer that question, and a single blended controls score cannot: it can only attribute residual to the dimensions where inherent risk is high, regardless of where your controls are genuinely strong or weak. Mapping the controls overlay to the dimensions it mitigates is what turns the residual from a score into a decision.
None of this requires re-assessing controls product by product. The controls remain a single entity-level assessment; what changes is that they are allocated to the risks they address rather than averaged into one number, with a governance overlay carrying the control-environment effects that genuinely are entity-wide. And once the overlay is dimension-aware, two refinements that a flat average forecloses come within reach differentiating control types, and letting operational evidence move the calibration both of which I return to below.
Pitfall 3: self-weighting and the non-linear board conversation
The third property is subtler and lives in the controls layer. When AMLA combines the control-category scores into the overall controls quality score, it weights each category by its own score: the weaker a category (the higher its score), the more weight it carries (RTS Article 3(5)). The same self-weighting governs the final inherent aggregation (Article 2(5)). The intent is sound as it stops a handful of strong categories from masking a single deficient one, and it ensures the worst area dominates the result. For a supervisor who wants the weakest link to drive the score, this is good design.
But pair self-weighting with the conditional average and you get a system whose output does not move linearly with control investment. Improve your worst control category and you do two things at once: you lower its score, and you reduce the weight that score carries in the overall calculation. The two effects interact, and the residual moves by an amount that is hard to predict in advance and harder still to narrate after the fact. The Board conversation becomes: “we invested in our weakest control area; the headline residual moved less than the spend would suggest, because improving that area also reduced how much it counted.” That is a true sentence and an unpleasant one to deliver to a Risk Committee.
For a ranking engine, none of this matters you only need the final position, not a smooth relationship between input and output. For resource-allocation planning, the relationship is the product. Fixed, principled control weights anchored to a coherent framework rather than to the scores themselves restore predictability: a unit of control improvement maps to a knowable residual movement you can put in a business case before you spend. You give up the automatic worst-area prioritisation that self-weighting provides; you gain a model your Board can plan against. Different purpose, different choice.
Working around the pitfalls: what to keep, what to rework
It is right to treat the AMLA model as a skeleton to populate, not a checklist to copy. Two moves in particular I would underline and adopt without change. Adopt the category architecture verbatim four inherent categories, seven control categories; it costs nothing and it is exactly what your supervisor will look for. And apply the conditional rule’s hard floor as written. The discipline that controls cannot pull residual below inherent unless they genuinely outperform the risk is the best anti-gaming feature in the model. Then rework the residual layer for the job it now has to do:
- Preserve dimensional granularity. Keep per-category residuals beneath the aggregate. This is the highest-return adjustment; it converts a ranking number into a control map.
- Map the controls overlay to the dimensions it mitigates. Keep controls as a single entity-level assessment, but allocate them to the risks they address with a governance overlay across all so the residual reveals where control investment actually pays off, not merely where inherent risk is highest.
- State your mitigation ceiling and defend it. Decide, on the record, how much your control programme can reduce inherent risk and why rather than inheriting an undeclared ~37.5% from the averaging arithmetic.
- Consider a proportional residual over the conditional average. A multiplicative mitigation scales with the inherent level, moves smoothly with control quality, and carries a ceiling you set deliberately all better suited to resource allocation than a discontinuous mean built for ranking robustness.
- Differentiate control types. Preventive controls stop events occurring; detective controls surface them after the fact; corrective controls address consequences. They reduce risk through different mechanics, and a model that prices that difference calibrates control investment far better than treating every control as equivalent in a flat average which is what the supervisory model does.
- Let operational data move the score where you have it. AMLA’s model is static by necessity: cross-entity comparability forbids feeding one entity’s SAR volumes or confirmed cases back into its own calibration. Your EWRA is under no such constraint. Where you hold the data, an empirically informed inherent calibration will beat expert judgement standing alone.
The throughline is simple. AMLA optimised for comparability and robustness because it is ranking a population. You are allocating finite resources against your own risk, so optimise for granularity and predictability. Same architecture; a different residual engine underneath it. And note the deadline that makes this practical rather than academic: from 10 July 2027, the parallel RTS under Article 40(2) AMLD6 will put these same data points on your national supervisor’s desk anyway. Building the EWRA that uses them well is no longer optional preparation it is the difference between defending your methodology on your own terms and discovering you were graded on someone else’s.
FAQs practitioners are actually asking
Doesn’t AMLA use a single entity-level controls score? How can residual be per dimension?
AMLA does collapse its seven control categories into one score and apply it once that is the ranking design. But entity-level controls can equally be mapped to the dimensions they mitigate: CDD to the customer dimension, monitoring to the transactional, sanctions to the geographic, with governance as an overlay across all. The single score is just the average of those mapped controls. Keeping them mapped, rather than averaged, is what lets the residual show where to invest without ever assessing controls product by product.
Can I use AMLA’s residual risk formula directly in my EWRA?
You can, and the conditional structure is worth importing for the discipline it imposes. But be clear-eyed that you are importing a ranking engine’s compression. For resource allocation you will want to preserve dimensional detail and reconsider the averaging step itself.
What is the maximum risk reduction achievable under the averaging rule?
At the top of the inherent scale (4.00), with flawless controls, 37.5%. It tightens as inherent falls – about 30% at an inherent of 2.50. And it is emergent, not a calibrated policy, so adopting the rule means adopting a mitigation ceiling no one actually designed.
Should I preserve per-category residual scores internally?
Yes, it is the highest-value, lowest-cost adjustment you can make. A single residual ranks well but cannot tell you where to allocate; two products with the same score can demand completely different investment.
Is the hard floor in Case (i) worth keeping?
Unequivocally. The rule that controls cannot pull residual below inherent unless they genuinely outperform the risk is the model’s strongest anti-gaming feature. Keep it whatever else you change.
Why differentiate control types if AMLA doesn’t?
Because AMLA is ranking and you are allocating. A flat average is robust for cross-entity comparison; for investment decisions you need to know whether a euro spent on prevention or on detection moves residual more, and that requires a control-type sensitivity the supervisory model deliberately omits.
Does any of this mean AMLA’s methodology is flawed?
No. It is well-engineered for selecting forty entities from a large population, and from 10 July 2027 the same data points will shape how every obliged entity is seen. The point is narrower and more useful: a selection engine and a resource-allocation engine are different instruments, and the residual layer that suits the first needs rework for the second.
Read related blog articles:
AMLA’s Risk Scoring Methodology: What Financial Institution Needs to Know
Monitoring Before the Relationship: What AMLA’s Draft RTS Means for Transaction Monitoring
Adam Anklewicz is an independent AML/CFT risk practitioner (CAMS, PRM, CGSS) with 20+ years across banking, fintech, and payments, most recently as Risk Director at an EU-licensed electronic money institution. The observations here draw on independent work developing a product-level ML/TF/PF risk assessment methodology. This commentary is written in a personal capacity, reflects the author’s own views, and is not legal advice.
Connect with the author: LinkedIn